INFRASTRUCTURE
MONITORING
Centralize your metrics at any scale on Prometheus-as-a-service. Unified with logs and traces.
COLLECT METRICS
Centralize your Prometheus metrics
- Add just three lines of code to your Prometheus config files to begin forwarding your metrics to Logz.io for storage and analysis.
- Collect metrics with existing Prometheus deployments and store them on Logz.io’s scalable SaaS platform.
- Logz.io stores metrics for 18 months, out-of-the-box.

DASHBOARDS

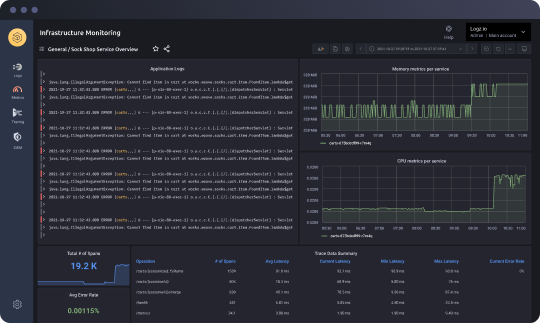
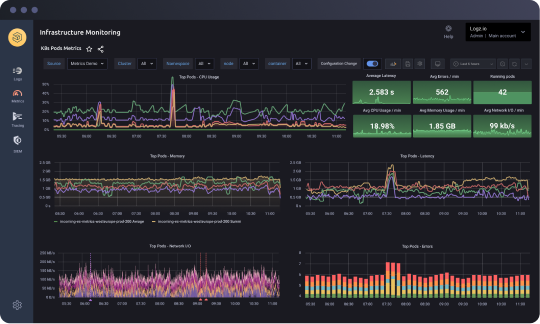
Step up your dashboarding and data visualization
- Quickly build, customize, and monitor data visualizations using PromQL. Drill into interesting trends with filters and a drag and drop interface.
- Easily migrate existing Grafana dashboards to Logz.io.
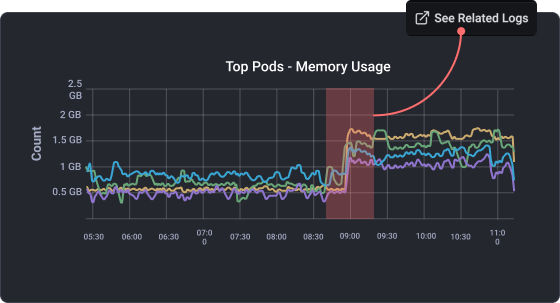
- Correlate metrics with recent deployments to identify the source of new problems.
CORRELATION
Investigate problems in context with data correlation
- Logs:
Debug new problems right away
- Traces:
Pinpoint problems in your microservices faster
- Deployments:
See which deployments caused new problems

ALERTING

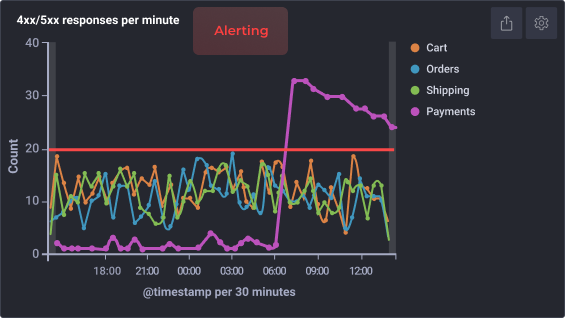
Stay notified of new issues with real-time alerting
- Set alerts once metrics cross thresholds for a predefined period of time.
- Combine metrics alerts with log or trace alerts to improve accuracy.
- Send alerting notifications to Slack, PagerDuty, OpsGenie, ServiceNow, Jira, and many more endpoints


What Else Can I do with Infrastructure Monitoring?
Prometheus-as-a-Service
Use the world’s most popular monitoring tool as a fully managed cloud service.V
Integrations
Integrate with your environment using simple integrations.
Dashboard Library
Hit the ground running with ready-made Grafana dashboards for various systems.
SSO
Simplify accessing Logz.io by using your organization’s credentials (AD, OKTA, OneLogin).
Sub Accounts
Segregate your Logz.io account into sub-accounts, each with its own data allowance and account token.
API
Use dedicated accounts for storing important data for extended periods of time.
User Control
Add as many users to your Logz.io account as you see fit. The number of allowed users depends on your plan.
Role Based Access
Manage permissions for your team and decide who has what type of access to which feature.


